American Age Distributions
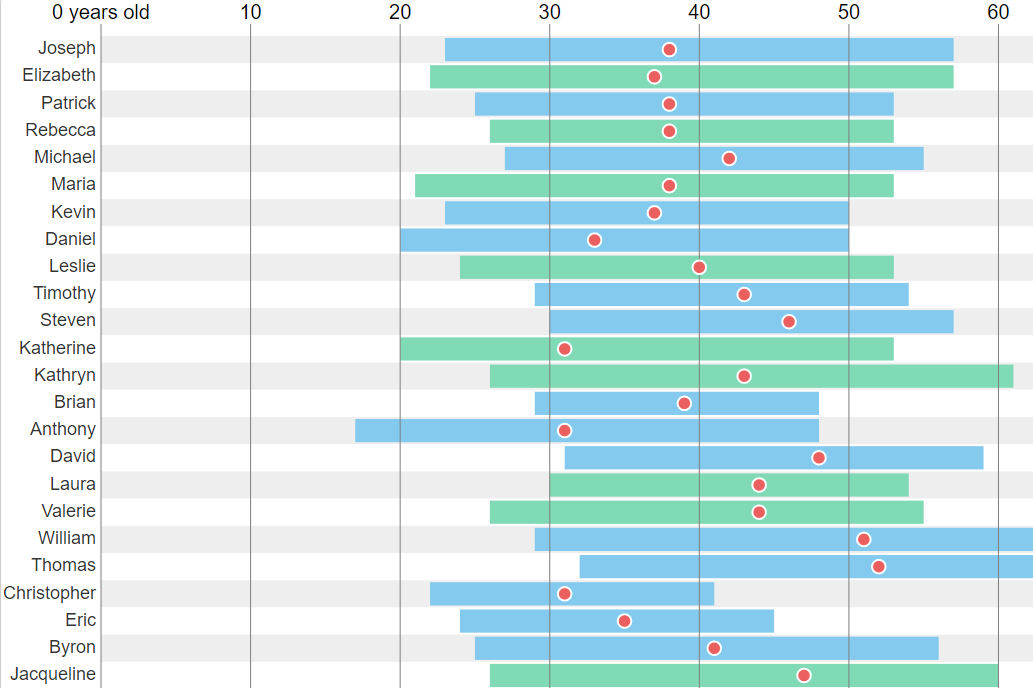
What's in a name? As part of an ongoing paper concerning the information inherent in a name, this visualization was created to expand on the results in a piece by FiveThirtyEight that estimated the age distribution of living Americans by their first name.
Maricopa Polling
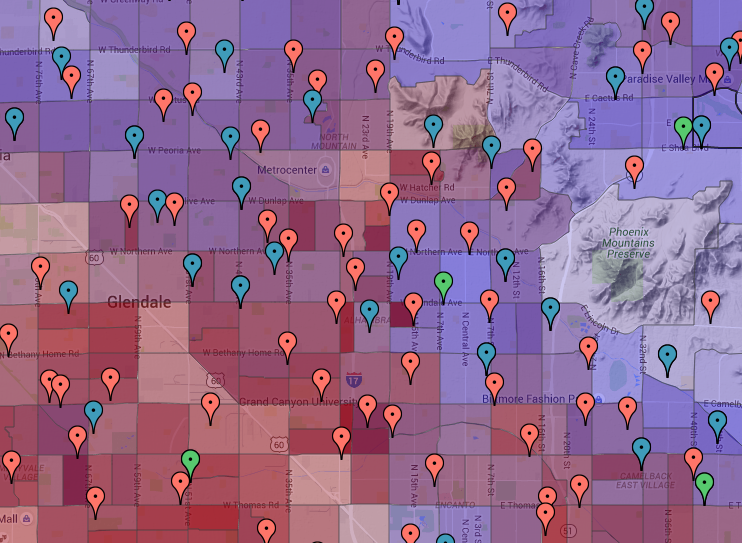
The reduced number and questionable placement of polling locations during the latest Presidential Preference election in Maricopa County elicited accusations of election fraud and voter disenfranchisement, especially in poorer and minority-majority communities. This map shows polling locations for the past three Presidential Preference elections as well as block level race statistics.
Predictive Visual Analytics Browser
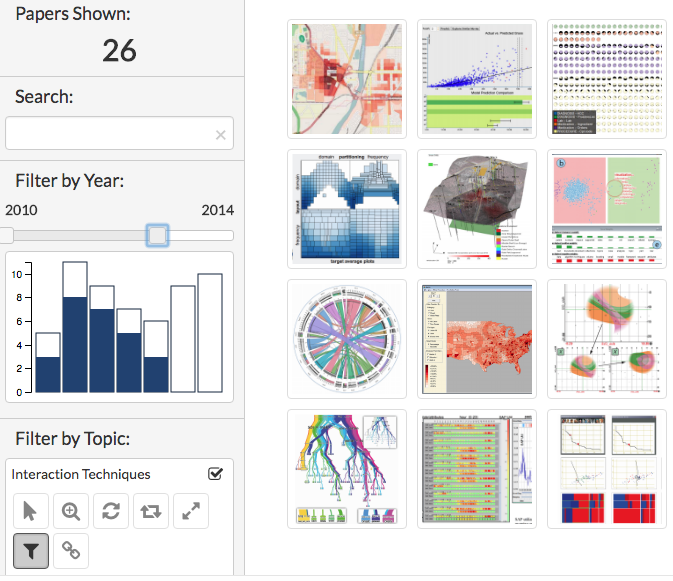
As part of a survey paper on the state of predictive visual analytics out of the VADER Lab, this browser was created to showcase the papers we will discuss. As opposed to the more conventional approach of an extensive, manual review of the literature, we analyzed the entire body of work out of several relevant journals and used topic modeling to initially select the relevant papers.
Euler Line
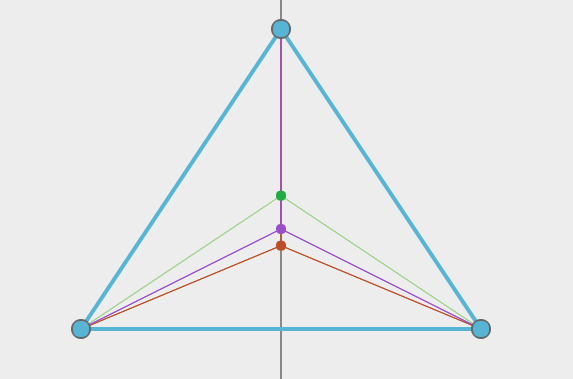
There are many ways of measuring the center of a triangle. This interactive javascript canvas shows that at least three of them—centroid, orthocenter, circumcenter—lie along a line coined the Euler Line.
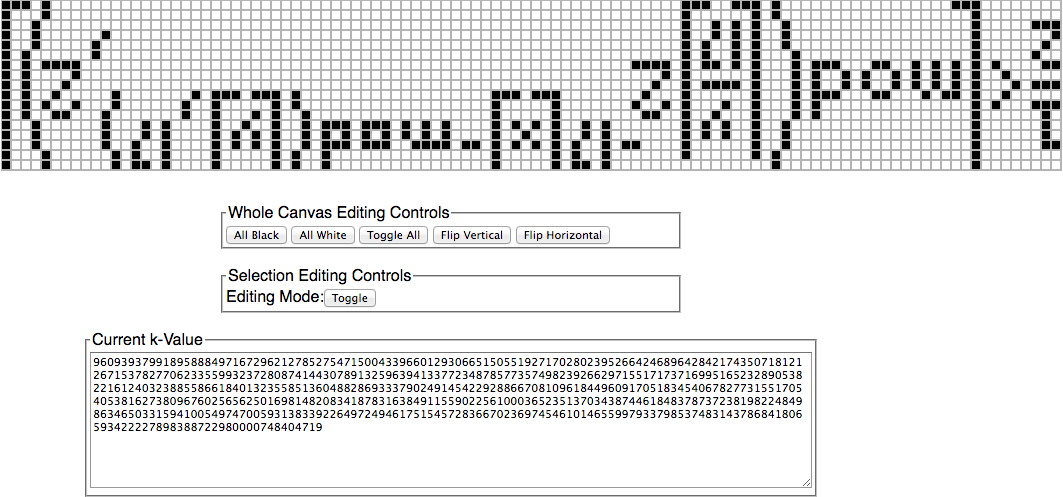
Tupper's Self-Referential Formula
A function that graphs itself, what could be more fun? This interactive javascript canvas not only shows the famous function, but also allows you to create your own images and find their corresponding k-values.
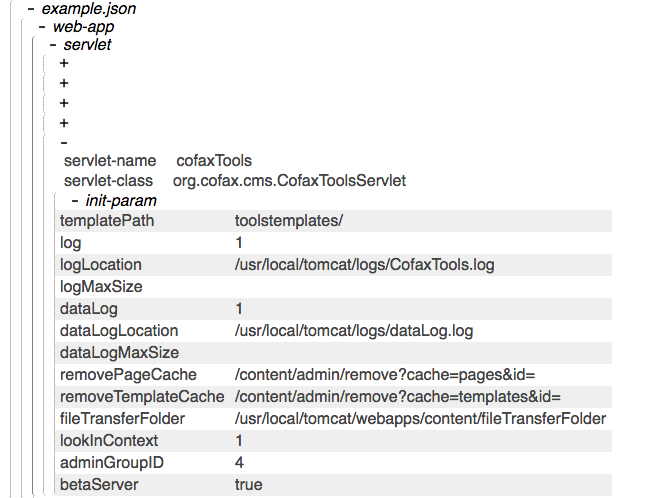
JSON Viewer
A simple drag and drop JSON viewer. Each level of the JSON is only parsed on demand so large and complex files can be parsed a single branch at a time avoiding clutter and long loading times.
3D Gravity Simulation
A solar system right in your browser! This gravity simulation utilizes customized GLSL shaders running through WebGL within an HTML5 Canvas. Note: Solar system not to scale.
